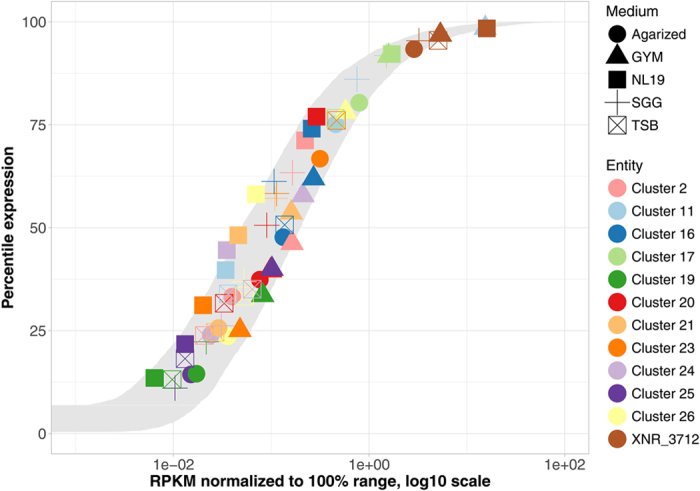
Figure 1.

The gray ribbon shows the range of percentile-logRPKM curves for all genes within the S. albus J1074 genome, grown in all 7 media (for any given percentile, the ribbon covers all observed logRPKM values, including minima and maxima). Subsets of 5 media (shape-coded) and 11 gene clusters (color-coded) are also shown, with additional horizontal and vertical jitter to alleviate data-point overlaps. The rpoB (XNR_3712; brown) gene expression is shown for reference.
