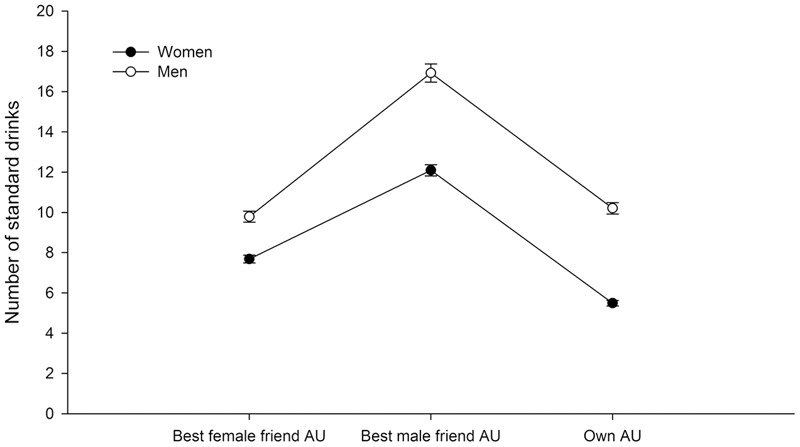
FIGURE 1.

Alcohol use (AU), expressed as the mean number of standards drinks consumed in a typical week, by each participant (own AU) and perceived number of standards drinks consumed in a typical week by the best female friend and best male friend. The vertical lines indicate the standard error of the mean. Refer to the text for significant differences that were found in the statistical analysis.
