Figure 1.

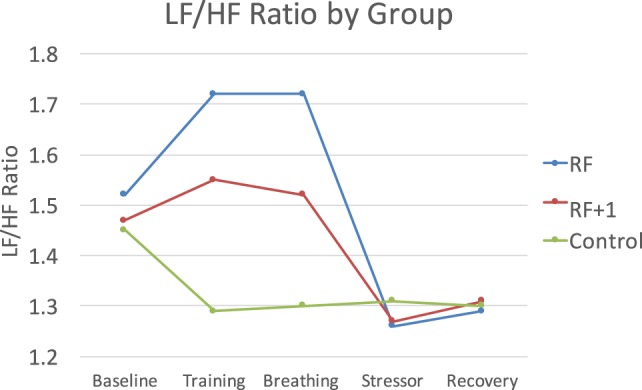
The RF group showed the largest LF/HF response to the breathing practice, with the RF + 1 showing minimal LF/HF changes and the control group decreasing during this time period.

The RF group showed the largest LF/HF response to the breathing practice, with the RF + 1 showing minimal LF/HF changes and the control group decreasing during this time period.