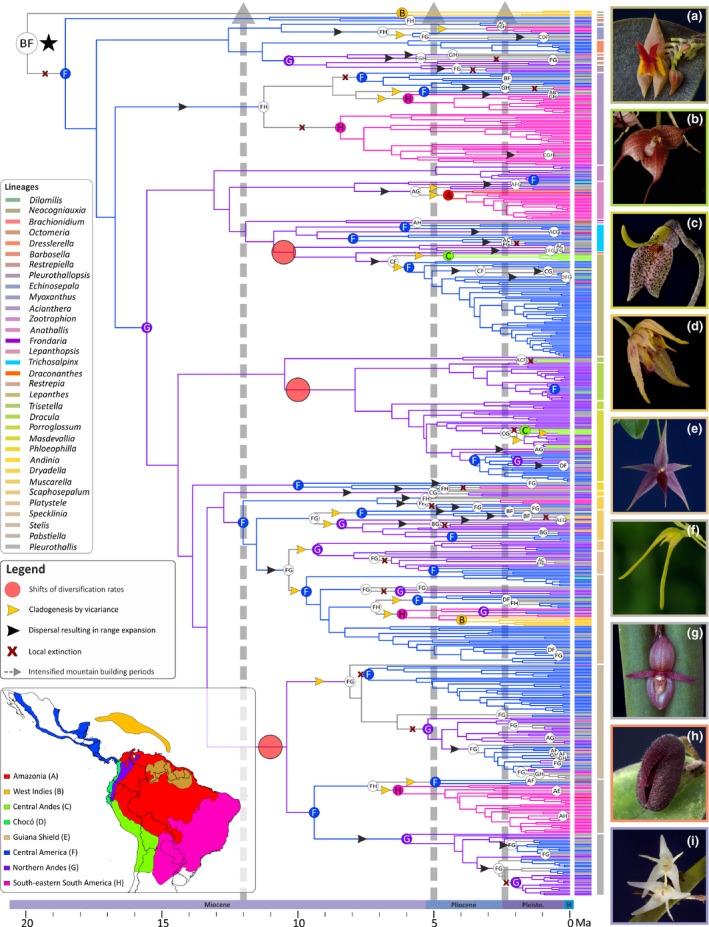
Figure 2.

Biogeographical history of Pleurothallidinae orchids. Letters on coloured circles at the nodes indicate the estimated ancestral area with the highest probability as inferred by BioGeoBears. Branches are colour coded following the reconstructed area of their corresponding node, and geographical ranges of every taxon are shown as vertical bars in front of the terminals. The black star indicates the most recent common ancestor of Pleurothallidinae. Grey arrows show the periods of accelerated Andean uplift (Gregory‐Wodzicki, 2000). Changes on shifts of diversification rates are shown as pale red circles on the branches. Range expansions, local extinctions and cladogenetic events via vicariance are indicated on the branches with black and yellow arrowheads and red crosses, respectively. Generic members of Pleurothallidinae are colour coded. Right panels show selected representatives of (a) Lepanthes (Lepanthes sp.); (b) Dracula (D. astuta); (c) Masdevallia (M. utriculata); (d) Muscarella (M. exesilabia); (e) Platystele (P. porquinqua); (f) Pabstiella (P. ephemera); (g) Pleurothallis (P. adventurae); (h) Dresslerella (D. pilosissima); (i) Myoxanthus (M. colothrix). Photographs: A. Karremans, D. Bogarín and O. Pérez. (Inset) Coded areas for biogeographical analysis. Political divisions obtained from DIVA‐GIS (http://www.diva-gis.org/gdata). Timescale shown at bottom is expressed in million years ago, Ma.
