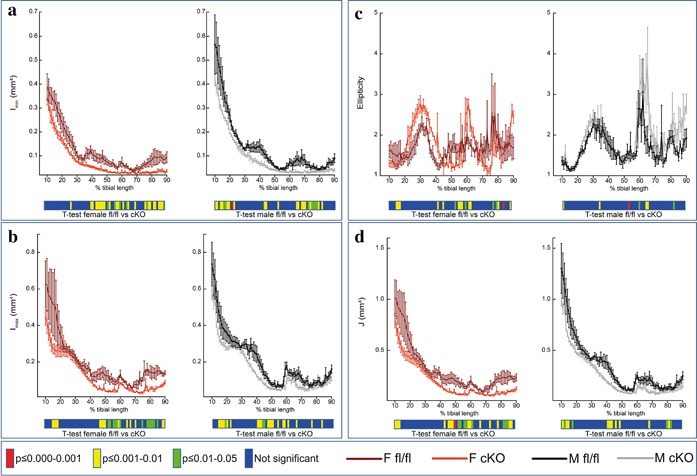
Figure 3.

Whole bone analyses of cortical bone between 10% and 90% of total tibial length, excluding proximal and distal metaphyseal bone, of female fl/fl (brown), female cKO (orange), male fl/fl (black), and male cKO (gray) tibia at 6 weeks of age showing (a) Imin (mm4), (b) Imax (mm4), (c) ellipticity, and (d) resistance to torsion (J; mm4) Graphs represent mean ± SEM, n = 4/group. p < 0.05 was considered to be significant and p ≤ 0.01–0.05 was noted as green, p ≤ 0.001–0.01 as yellow, and p ≤ 0.000–0.001 as red. Not significant is noted as blue
