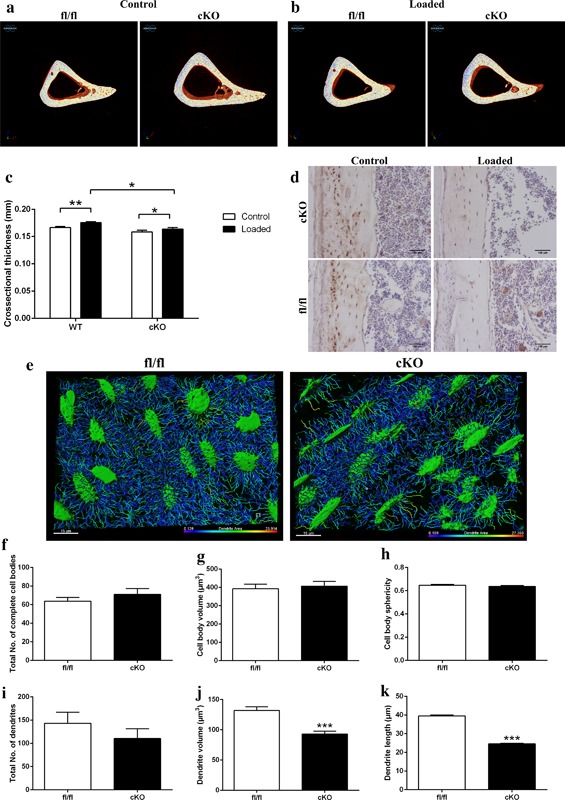
Figure 5.

Representative images of fl/fl and cKO mice in (a) control and (b) loaded limbs. (c) Cortical cross‐sectional thickness at 37% of the tibia length as assessed by microCT analysis. (d) Immunohistochemical labeling of sclerostin in osteocytes of cortical bone of loaded and control 6‐week‐old Pdpn cKO and fl/fl mice. Arrows are pointing at embedded osteocytes within the cortical bone and their dendritic processes projecting from the cell bodies. Images are representative of n = 4/sex/genotype. Scale bar = 20μm. (e) Laser confocal z‐stack, single channel outlining phalloidin‐Factin staining was imaged in the cortical bone. Imaris cell surface rendering was applied to cell bodies and Imaris FilamentTracer applied to dendritic processes and these were colored according to length. Quantification of osteocyte parameters in 6‐week‐old male fl/fl, and cKO. (f) Total number of complete cell bodies in three volume fields. (g) Cell body volume (μm3). (h) Cell body sphericity. (i) Total number of dendrites in three volume fields. (j) Dendrite volume (μm3). (k) Dendrite length (μm). Data are represented as mean ± SEM. *p < 0.05, **p < 0.01, ***p < 0.001
