
Figure 4.
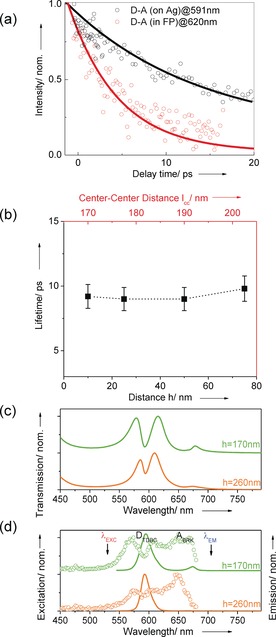
a) The decay kinetics of the donor‐acceptor (h=50 nm) outside cavity at the TDBC absorption maximum 591 nm (black circles), and of MP in the strongly coupled system at 620 nm (red circles). b) The lifetimes of MP recorded at different spacer thickness for the strongly coupled donor–acceptor cavity. c) Normalized transmission spectrum of cavities with spacer thicknesses h=170 and 260 nm. d) Normalized excitation (dots) and emission (solid line) spectra as in Figure 3.