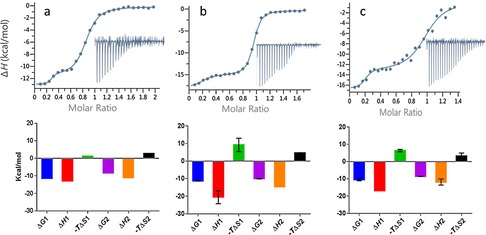
Figure 3.

Top: ITC measurements of peptide–TLE1 binding interactions. Data fitting to a two‐site independent binding model are shown; integrated heats are shown in the inset. Bottom: Histograms showing ΔG, ΔH, and −TΔS. The thermodynamic values are also presented in Table 1. a) MWRPW–TLE1 binding, n=1. Experiment performed with TLE1 (40 μm) and MWRPW peptide (420 μm). b) FWRPW–TLE1 binding, n=2. Experiment performed with TLE1 (30 μm), FWRPW peptide (240 μm), and then repeated with TLE1 (24 μm), FWRPW peptide (180 μm). Histograms represent averaged values; error bars denote SD. c) 18–TLE1 binding, n=2. Experiment performed with TLE1 (30 μm), 18 (200 μm) and then repeated with TLE1 (30 μm), 18 (180 μm). Histograms represent averaged values; error bars denote SD.
