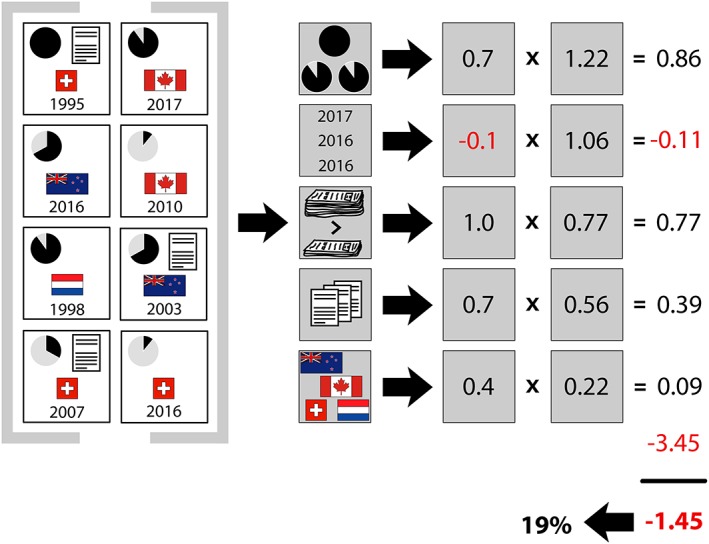
Figure 1.

vigiRank computes a score for each considered drug‐ADR pair and then ranks all pairs based on their respective score from highest to lowest priority in the subsequent clinical assessment. In this fictional example, there are 8 reports on a given drug‐ADR pair, conceptually summarised in the leftmost section. For example, the top left report is Swiss, includes a case narrative, attains a vigiGrade completeness score6 of 1.0, and was received in 1995. The second section shows the raw data for each of the predictors: 3 informative reports (completeness score ≥ 0.9), 3 recent reports (entered during the last 3 years), disproportionality = TRUE (standard global IC analysis7, 8 or a locally disproportional pattern9), 3 reports with case narratives, and 4 countries of origin with positive IC.7, 8 The third section displays how the raw data are transformed and multiplied with their corresponding data‐driven coefficients. The fourth section sums the independent contributions from all variables with the intercept (−3.45) to produce the overall value of −1.45 on logit scale, corresponding to a probability of 0.19, denoted the vigiRank score. The logit value and the score are equivalent for ranking purposes. The theoretical maximum and minimum of the vigiRank score are 0.34 and 0.011, respectively. If only disproportionality is present, the resulting score is 0.023. Note that 2017 is used as the reference point to determine whether a report is recent. This figure has been reproduced from Caster et al5 with slight modifications. [Color figure can be viewed at wileyonlinelibrary.com]
