
Figure 2.
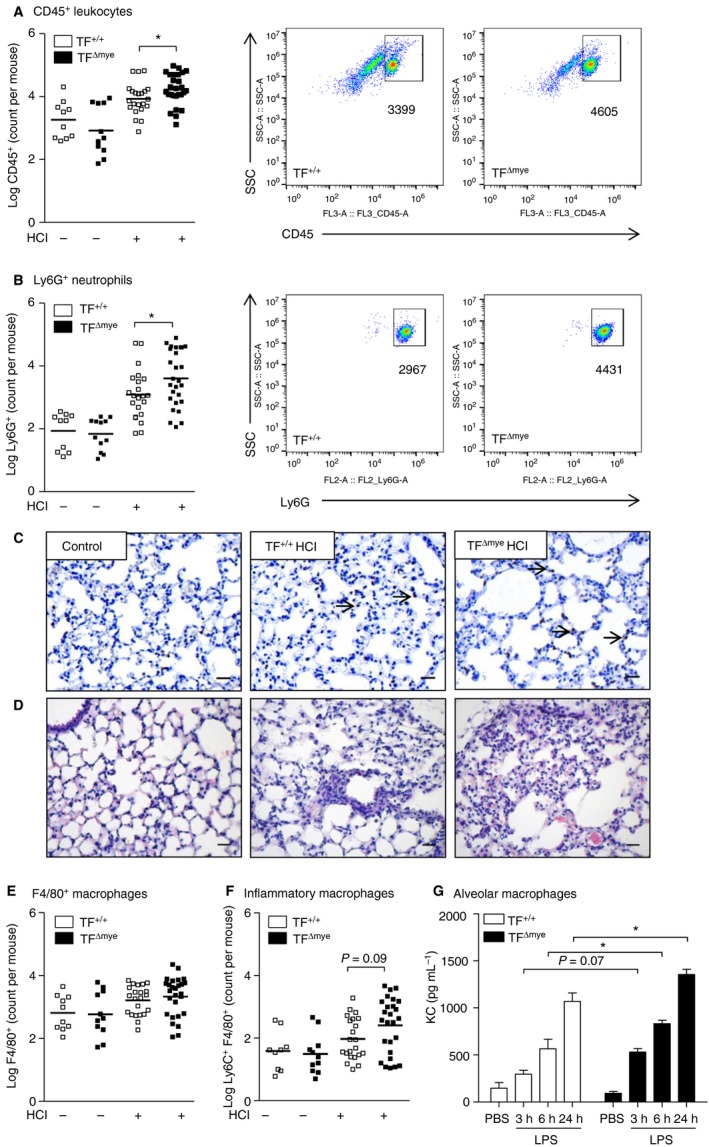
The effect of myeloid tissue factor (TF) on pulmonary leukocyte recruitment during acute lung injury (ALI). (A, B, E, F) Flow cytometric analysis of leukocytes in the bronchoalveolar lavage fluid of control mice (n TF +/+ = 10; n TF Δmye = 11) and HCl‐treated (n TF +/+ = 22; n TF Δmye = 27) myeloid TF‐deficient mice or wild‐type mice 8 h after ALI. (A) CD45+ leukocytes. (B) CD45+ Ly6G+ F4/80− neutrophils. (E) CD45+ F4/80+ macrophages. (F) CD45+ Ly6C+ F4/80+ inflammatory macrophages (n control TF +/+ = 9; n control TF Δmye = 11; n HC l TF +/+ = 21; n HC l TF Δmye = 26). (A, B) Representative blots of HCl‐treated mice. (C,D) Lung sections of myeloid TF‐deficient mice or wild‐type mice 8 h after ALI induction stained for GR‐1 and hematoxylin (C) or hematoxylin and eosin (D). Scale bar: 25 μm. Magnification: × 200. Arrows indicate neutrophils. (G) Alveolar macrophages were stimulated with lipopolysaccharide (LPS) for the indicated time points in vitro, and released chemokine (C‐X‐C‐motif) ligand‐1 (KC) was measured by ELISA; n = 3. For statistical analysis (A–F), unpaired Student's t‐tests and (G) two‐way anova with Sidak's multiple comparison were performed; *P < 0.05. Littermate‐controlled experiments were performed. PBS, phosphate‐buffered saline.