
Figure 4.
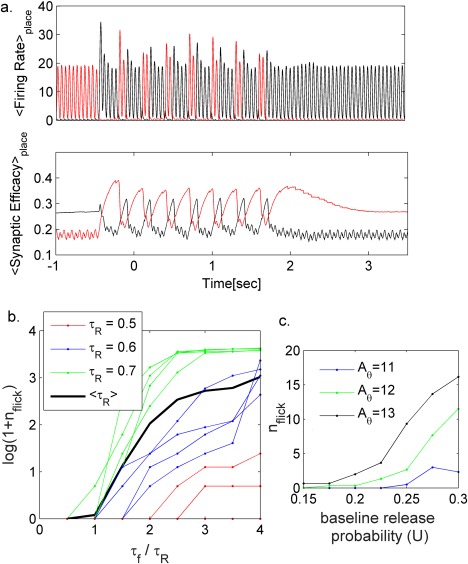
Effect of short‐term synaptic plasticity on the occurrence of flickering events. (a) Average firing rate of the units that encode the current location (upper panel, see methods) and corresponding average synaptic efficacies (lower panel), red—units in the previously active population, black—units in the population encoding the new environment. The occurrence of flickering events depends on the difference between the synaptic efficacies (lower panel) in the two populations. A θ = 12 Hz other parameters as in Figure 2. (b) Influence of the ratio between facilitation and depression time constants on the number of flickering events. Black line, average number of flickering events over different ( ). Colored dots: single simulation results; each color corresponds to different . Aθ = 12Hz, other parameters as in Figure 2. (c) Effect of baseline release probability U on the number of flickering events for different amplitudes of theta modulation (see also Supporting Information Figure S11) [Color figure can be viewed at wileyonlinelibrary.com]