
Figure 6.
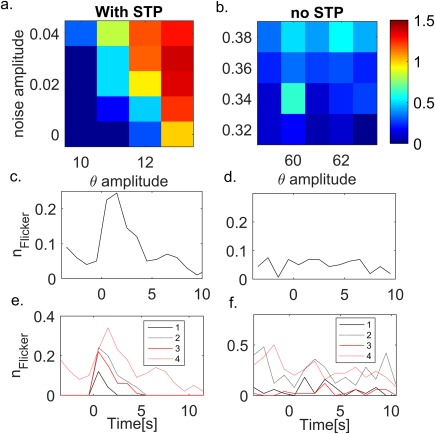
Noise increases flickering probability. (a) Average number of flickering events (over five different realizations) for different amplitudes of theta modulation and noise strength. Network with STP in the synaptic connections (parameters as in Figure 2, see Table 1). (b) As in (a), but the synapses in the network have no STP. (c) Time course of the number of flickering events (averaged over two different noise values, A n = 0.01, 0.025, and 5 network realizations) for a network with STP in the synaptic connections. The probability of flickering exhibits a transient increase as a result of STP. A θ = 12 Hz, all other parameters are the same as in Figure 2. (d) Time course of the number of flickering events in a network without STP in the synaptic connections. The probability of flickering events is approximately constant throughout the simulation. Parameters: A n = 0.3, 0.4. (e) Network with STP: time course of the number of flickering events for different noise and theta amplitudes (averaged over five realizations). Higher theta and noise amplitude results in higher probability for flickering events and longer transient increase in flickering probability. (3) A θ = 12 Hz, A n = 0.01 (4) A θ = 12 Hz, A n = 0.025 (1) A θ = 11 Hz, A n = 0.01 (2) Aθ = 11 Hz, A n = 0.025. (f) As in (e) for a network without STP. Flickering probability is constant in time for all noise and theta amplitudes. A θ = 62 Hz, A n = 0.3, A θ = 62 Hz, A n = 0.4, A θ = 60 Hz, A n = 0.3, A θ = 60 Hz, A n = 0.4 [Color figure can be viewed at wileyonlinelibrary.com]