
Figure 1.
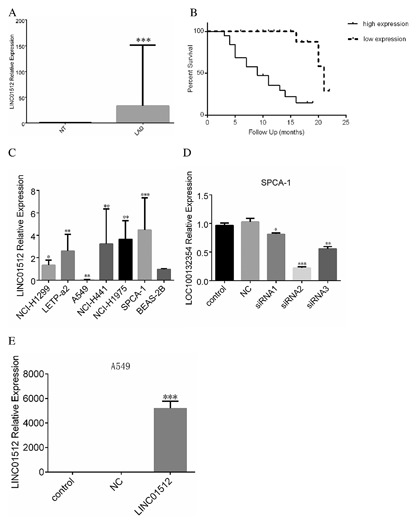
Expression level of LINC01512 in LAD tissue, cells, three A549 cell groups, three SPCA‐1 cell groups. (A) Comparison of the relative expression levels of LINC01512 in LAD and adjacent tissues. LINC01512 expression level of LAD was significantly higher than the adjacent tissue. **P < 0.01. (B) The correlation of LINC01512 expression with the survival of LAD prognosis. The survival time of LINC01512 high‐expression group was significantly shorter than that of the low‐expression group. (C) Comparison of LINC01512 expression levels in six LAD cell lines. The expression levels of LINC01512 from NCI‐H1975, SPCA‐1, and NCI‐H441 cells were highly expressed. The expression level of SPCA‐1 was the highest, and that of NCI‐H1299 and LETP‐a2 was moderate, while that of A549 cells was the lowest. *P < 0.05, **P < 0.01, ***P < 0.001. (D) Comparison of interference efficiency of PCR amplification of three LINC01512 interference sequences. siRNA2 group exhibited the highest interference efficiency. (E) Overexpression of LINC01512 in three A549 cell groups. The overexpression level of LINC01512 in A549 cell line was significantly higher than that in the control and NC groups. *P < 0.05, **P < 0.01, ***P < 0.001. The relative expression level of LINC01512 was used to calculate the relative lncRNA concentrations (ΔCt = Ct median lncRNA − Ct median β‐actin), and 2−ΔΔCt was calculated as the relative expression.