
Figure 3.
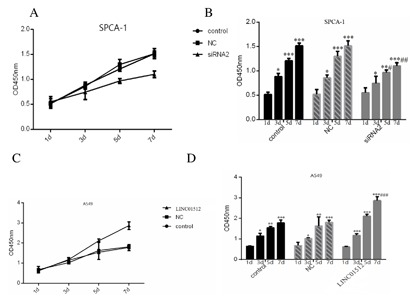
Comparison of cell proliferation in three different treatment groups on different days of the CCK‐8 assay. (A) The curve of three SPCA‐1 groups of different days. (B) Illustration of three SPCA‐1 groups of different days. (C) The curve of three A549 groups of different days. (D) The illustration of three A549 groups of different days. *P < 0.05, **P < 0.01, ***P < 0.001, #P < 0.05, ##P < 0.01.