
Figure 6.
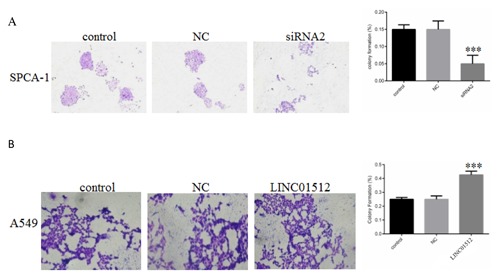
Results of cell clone formation were compared. (A) The clone formation rate of siRNA2 group (5.00 ± 0.81%) was significantly lower than that of the control (14.97 ± 1.34%, P = 0.0018) and NC groups (15.13 ± 2.31%, P = 0.0011). (B) Clone formation rate in the control (25.01 ± 1.37%, P < 0.001) and NC groups (26.15 ± 2.48%, P < 0.001) was significantly lower than that in the LINC01512 group (42.57 ± 2.71%) after LINC01512 overexpression. **P < 0.01, ***P < 0.001.