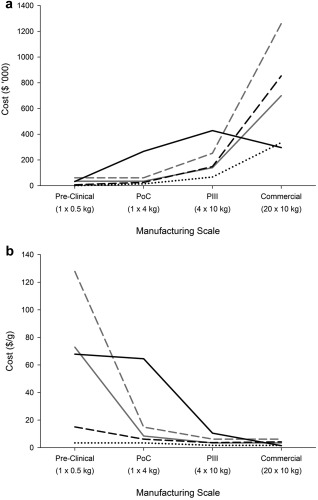
Figure 2.

Direct cost of goods category breakdown across the different manufacturing scales required for each development phase for the base case scenario shown as (a) direct cost per product per phase and (b) direct cost per gram.
Categories: labor costs (gray dashed line), QCQA batch release costs (gray solid line), chromatographic resin costs (black solid line), fermentation media (black dotted line), and single‐use components and buffers (black dashed line).
