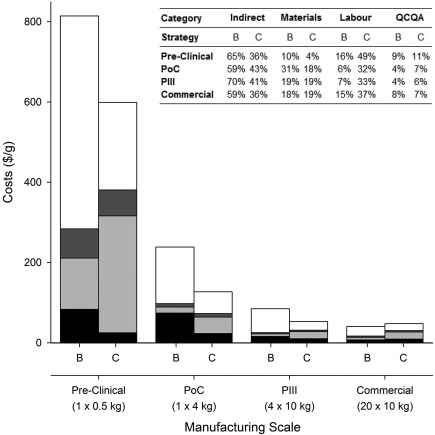
Figure 4.

A comparison of the direct costs per gram for the base case batch strategy (B) and fully continuous strategy (C) on a category basis for material costs (black), labor costs (light gray), QCQA batch release costs (dark gray), and indirect costs (white), between the different manufacturing scales.
The embedded table highlights the percentage cost contribution for the key direct cost categories.
