Figure 7.

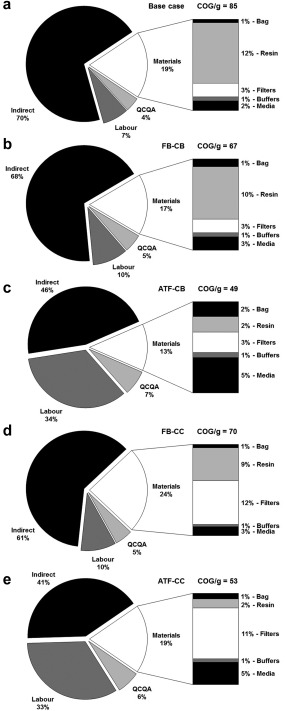
A comparison of cost of goods per gram with a detailed breakdown of material costs on a category basis for (a) the base case, (b) FB‐CB, (c) ATF‐CB, (d) FB‐CC, (e) ATF‐CC scenario for a Phase III clinical batch in a medium‐sized company.

A comparison of cost of goods per gram with a detailed breakdown of material costs on a category basis for (a) the base case, (b) FB‐CB, (c) ATF‐CB, (d) FB‐CC, (e) ATF‐CC scenario for a Phase III clinical batch in a medium‐sized company.