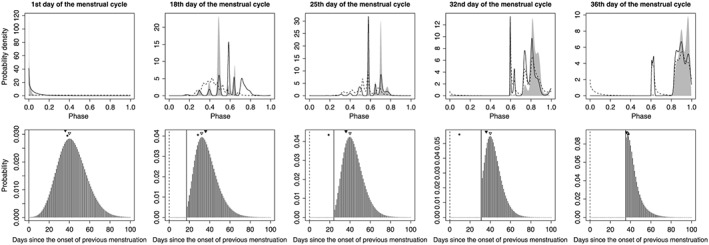
Figure 2.

Example estimated conditional distributions for menstrual phase (top panels) and the associated predictive distributions for the day of onset of menstruation (bottom panels). In the top panels, predictive and filtering distributions are shown as dashed and solid lines, respectively, and smoothed distributions are represented by gray shading. x‐axes represent θ tmod1. In the bottom panels, the marginal probabilities of the onset of menstruation h(k|Y t,Z t) are shown. Dashed and solid vertical lines indicate the day of onset of the previous menstruation and the current day, respectively. Filled circles indicate the actual day of onset of the next menstruation. Filled and open triangles indicate the best conventional prediction for the subject and the model‐based prediction, respectively. These results were obtained by applying the best Akaike information criterion model to the first menstrual cycle of the test data of subject 1. From left to right, panels correspond to 38, 21, 14, 7, and 3 days before the upcoming day of onset of menstruation, respectively.
