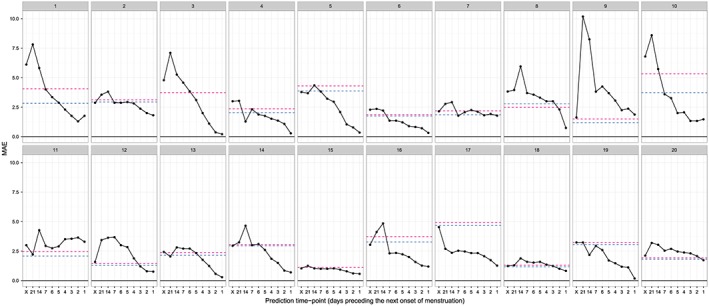
Figure 4.

Mean absolute error (MAE) of the prediction of the day of onset of the next menstruation. Solid lines indicate the MAE of the sequential prediction (based on the best Akaike information criterion model for each subject), and horizontal dashed lines indicate the lowest MAE of the conventional prediction (blue) and the MAE of prediction based on the method of Bortot et al. 6 (red) for each subject. On the horizontal axis, ‘X’ indicates the prediction obtained at the day of onset of the previous menstruation. Each panel shows the results for one subject.
