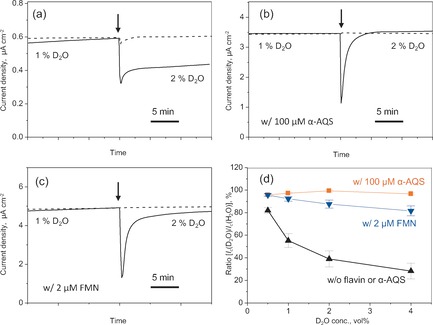
Figure 2.

Time versus current production (Ic) for a monolayer biofilm of S. oneidensis MR‐1 in an electrochemical system containing 10 mm lactate (a), and additionally 100 μm anthraquinone‐1‐sulfonate (α‐AQS; b), or 2 μm flavin mononucleotide (FMN; c). The arrow indicates the time of the addition of D2O (solid line) or H2O (dotted line). The data corresponding to the dotted line were normalized to the data point just prior to the addition of D2O in the solid‐line data. d) The ratio of Ic before and 10 min after the addition of D2O versus the D2O concentration up to 4 % (v/v). The data are shown as the mean±standard error of the mean (n>3).
