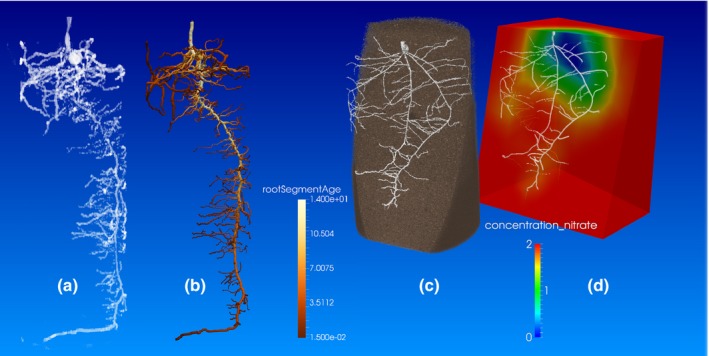
Figure 6.

Simulation of imaged root phenotypes. (a) Rendering of a magnetic resonance image of a 2‐wk‐old maize root system and (b) the simulation of that root system by OpenSimRoot. Pseudo‐colors in (b) show the root segment age as estimated on the basis of root topology, linear interpolation and the assumption that the emergence of laterals takes 2 d. (c) Rendering of a segmented X‐ray computed tomography (CT) image of a 10‐d‐old wheat root system. Soil has been sliced to make roots visible. (d) OpenSimRoot simulation of the predicted nitrate depletion zone of the imaged root phenotype in (c). We assumed an initially homogeneous distribution of nitrate within the simulated soil domain. Pseudo‐colors show the nitrate concentration on a plane cut approximately through the center of the root system.
