
Figure 2.
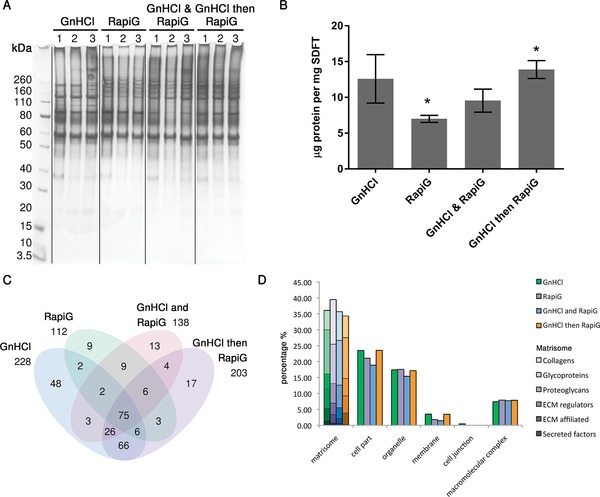
(A) 1D SDS‐PAGE analysis of the protein profiles of GnHCl, RapiGest™, GnHCl and RapiGest™, and GnHCl followed by RapiGest™ extraction methods. (B) Protein concentration yielded with the different extraction methods. Values are mean and error bars represent SD, *p < 0.05. (C) Venn diagram of the different extraction methods. (D) Classification of identified proteins for each extraction according to cell compartment (PANTHER) and matrisome classifcation (Matrisome Project). All identified proteins in each method can be found in Supporting Information Table 2.