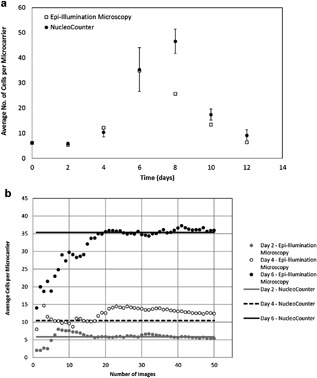
Figure 6.

(a) Twelve‐day cell growth profile of MSCs attached to Cytodex 1 microcarriers (error bars represent the standard error of the triplicate NucleoCounter measurements) and (b) Profile of average cell number per microcarrier in relation to the number of microcarriers analyzed using in situ epi‐illumination microscopy on days 2, 4, and 6 of the aforementioned 12‐day culture.
