
Figure 5.
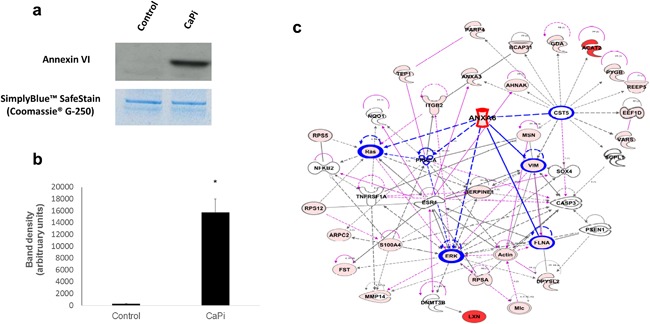
Enriched Annexin VI expression in calcifying VIC‐derived MVs and calcified aortic valve tissue. (a) Representative image of western blotting for Annexin VI in MVs isolated from VICs cultured in control and standard CaPi medium and (b) densitometry quantification showed increased expression of Annexin VI in calcifying VIC‐derived MVs. Results are presented as mean ± S.E.M. *p < 0.05 compared to control; n = 3. (c) Ingenuity pathway analysis showing the associations between Annexin VI and other proteins within the MV. The functions mapped by the dataset are represented by pink shadowed blocks. Functional interconnections between the proteins are shown by pink arrows and blue lines. The blue lines represent direct associations with Annexin VI. Dashed lines represent predicted associations