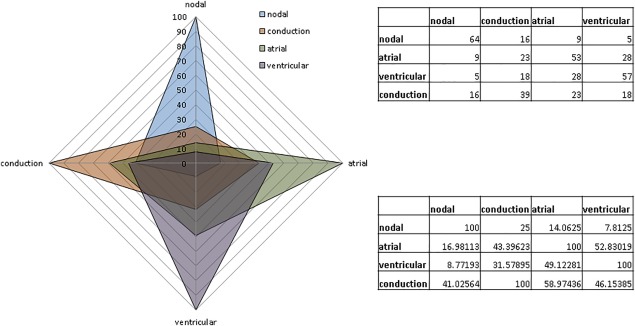
Figure 4.

Radar chart showing the significant overlap of “specific” features when scores from the four myocyte types for each chamber‐specific template are overlaid. Nodal and ventricular myocytes (VM) present the most distinctive differences when compared, while AM and VM overlap the most. Conduction myocytes present equal overlap with the other three types. Upper table: absolute values. Lower table and chart: values are percentage of total.
