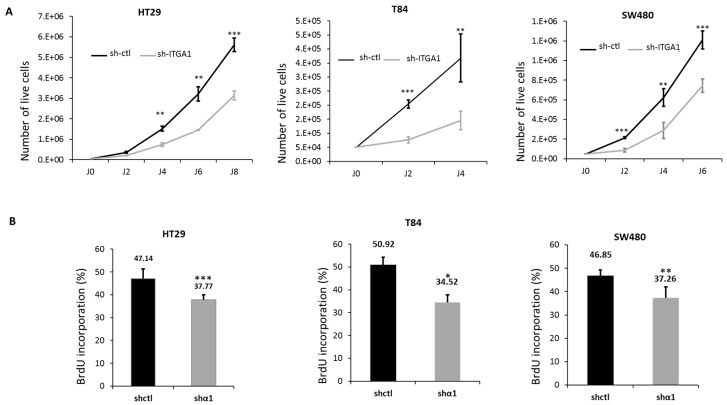
Figure 2.
Involvement of the integrin α1β1 in the proliferation of colorectal cancer cells. (A) Growth curves showing the cell counts up to 8 days after seeding of HT29, T84 and SW480. The curves show the number of live cells in the two groups; sh-ctl (black) and sh-ITGA1 (gray). Initially, 50000 cells were seeded into 6-well plates, and cells were counted every two days. (B) Histogram showing the results of 5-bromo-2′-deoxyuridine (BrdU) incorporation into the cells, performed 4 days after seeding of the same three cell lines. In each field, labeled nuclei were counted and compared to the total number of nuclei stained with 4′,6-diamidino-2-phenylindole (DAPI). The experiments were performed in triplicate and were repeated three times. Student’s t test. * p < 0.05, ** p < 0.01, *** p < 0.001.

