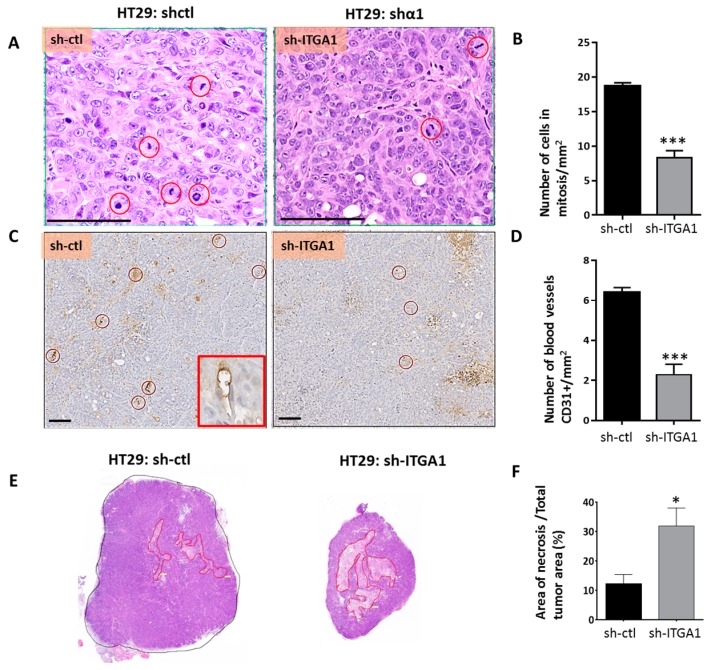
Figure 6.
Suppression of the expression of the integrin α1 subunit/ITGA1 results in fewer mitotic cells, fewer blood vessels and increased necrosis in xenografts. (A) Representative micrograph of tumor sections from HT29 sh-ctl and sh-ITGA1 cells stained with H&E. Mitotic cells are surrounded by a red circle. (B) Histogram showing the number of mitotic cells per mm2 in both sh-ctl and sh-ITGA1 tumors. For each tumor, four areas were randomly selected and analyzed for mitotic count. (C) Representative immunohistochemical staining showing intratumoral capillaries surrounded by a red circle. Endothelial cells were identified using anti-CD31 antibodies as shown in the red box. (D) Results of the count of the number of capillaries in the sh-ctl and sh-ITGA1 tumors. (E) Representative micrograph of sh-ctl and sh-ITGA1 HT29-derived tumors. Tumors were cut along the longest axis and then sections were stained with H&E. For each tumor, the necrotic eosinophilic areas are outlined in red. (F) Histogram showing the result of the percentage of necrotic areas compared to the total area of each tumor. The results represent the average analysis of three samples. Student’s t test. * p < 0.05, *** p < 0.001. Scale bar = 100 µm.

