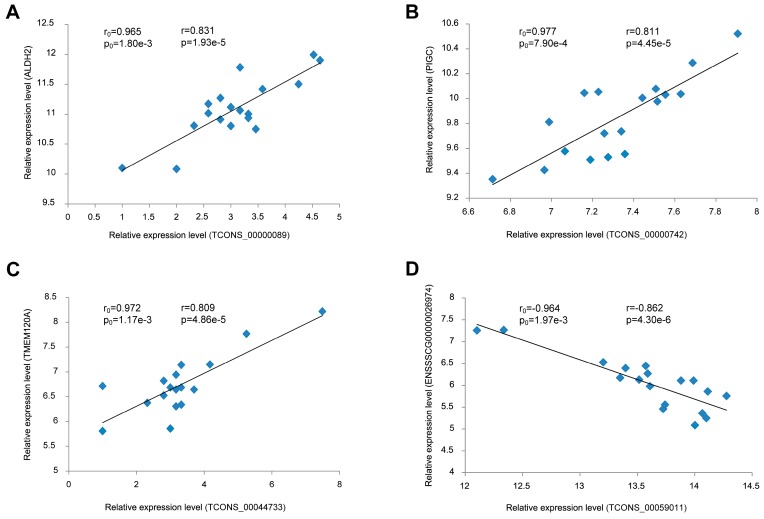
Figure 6.
Linear regression of DEL and DEPTG expression. The r0 and p0 indicate the Pearson correlation coefficient and p value of each pair of DEL and DEPTG in six samples (three for the Wannanhua group, and three for the Yorkshire group), respectively; while the r and p represent the mean in the 18 samples for validation. (A) TCONS_00000089 vs. ALDH2; (B) TCONS_00000742 vs. PIGC; (C) TCONS_00044733 vs. TMEM120A; (D) TCONS_00059011 vs. ENSSSCG00000026974.

