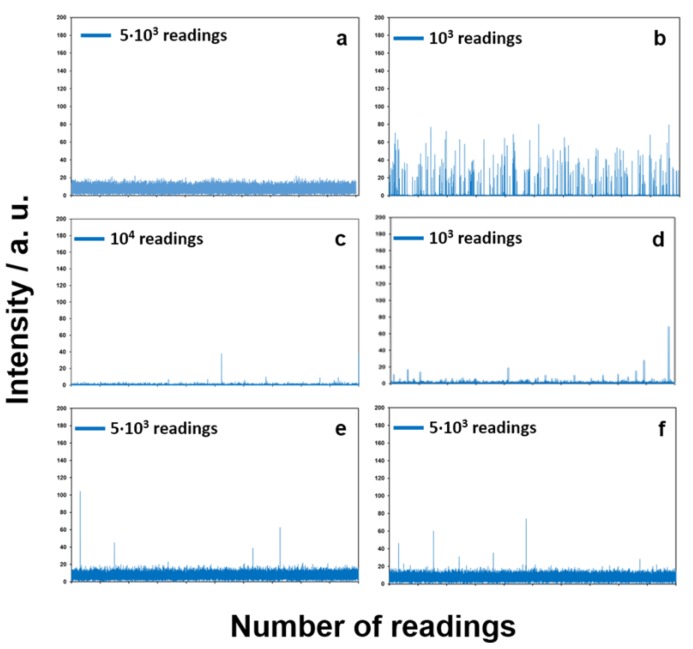
Figure 7.
Single particle inductively coupled plasma-mass spectrometry (SP-ICP-MS) spectra of control 1 μg/L Ag+ solution (a); control AgNP suspension (b); solution in contact with untreated leather (c); solution in contact with untreated leatherette (d); solution in contact with treated leather (e); solution in contact with treated leatherette (f). Y-axis goes from 0 to 200 a.u. with 20 a.u. increment, in all panels. Scale bars indicate number of data points along X-axis.

