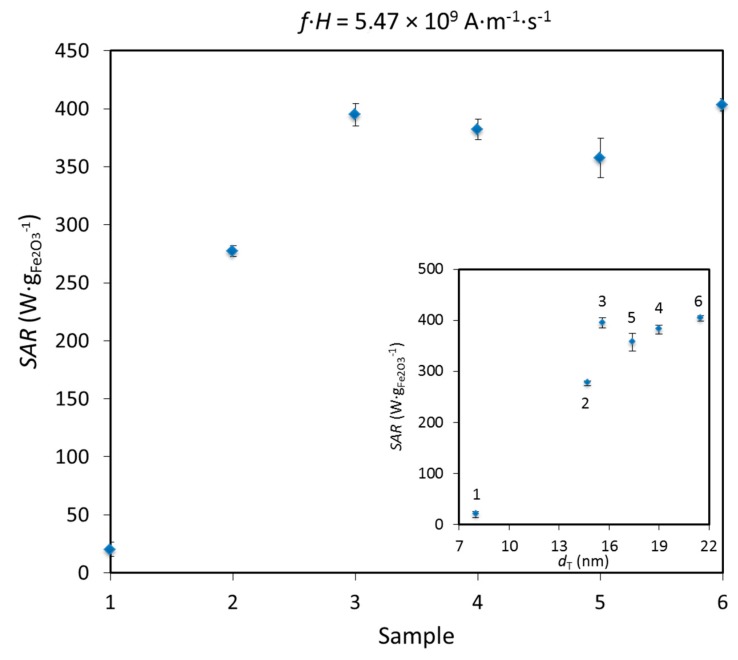
Figure 7.
SAR as a function of the sample’s number to observe the evolution of SAR with the prolonged HT duration of IONPs at the field parameters the closest to the clinical limit of the f·H product. The insert shows SAR as a function of dT at the same field parameters. The error bars indicate standard deviation.

