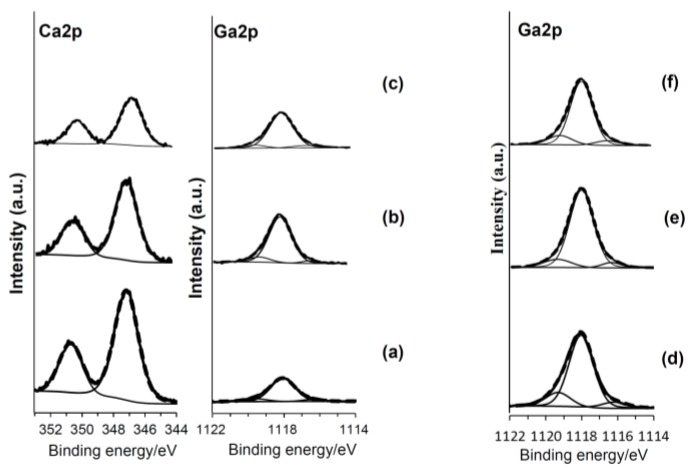
Figure 3.
XPS profiles of Ca2p and Ga2p on Ti subjected to (a) 100Ca + 0.05Ga; (b) subsequent heat, and (c) final water treatment, or (d) 100Ga; (e) subsequent heat, and (f) final water treatment. Thick line represents spectrum. Thin lines represent deconvolution lines. Dot line represents composite line.

