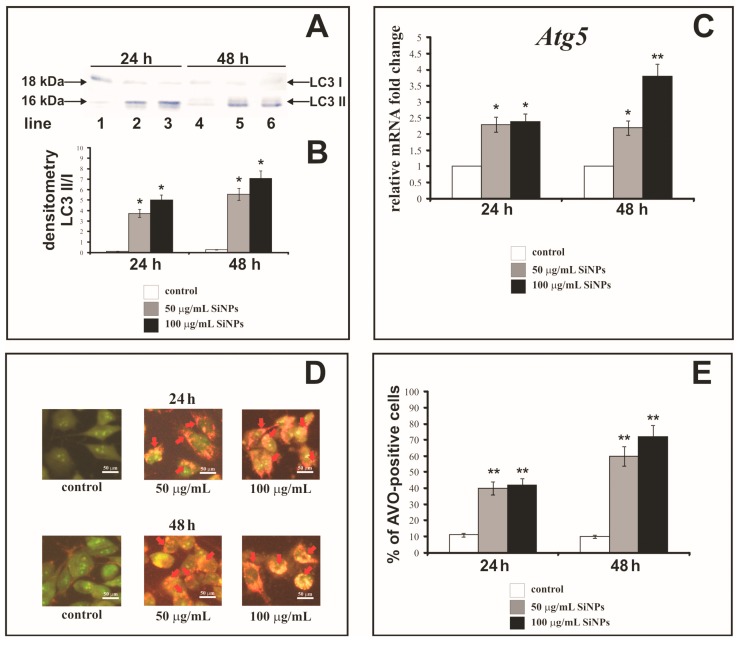
Figure 6.
Western blot analysis (A) and densitometric analysis (B) of LC3-I and LC3-II ratio in LBC3 cells incubated in medium with 50 and 100 µg/mL of 5–15 nm SiNPs for 24 and 48 h. Samples containing 20 μg of protein were submitted to electrophoresis and immunoblotting. A representative Western blot is presented on panel A and densitometric analysis—on panel B. Relative quantification of Atg5 gene expression in LBC3 cells (C). Results are shown as a relative fold change in mRNA expression in comparison to untreated controls, where expression level was set as 1. The effect of SiNPs on formation of AVOs in the LBC3 cell lines (D,E) evaluated by fluorescence microscope assay. The volume of the cellular acidic compartment was visualized by acridine orange staining. The cells were incubated in DMEM with 50 or 100 μg/mL of 5–15 nm SiNPs for 24 or 48 h and the cells were photographed under a fluorescence microscope at 200-fold magnification, (scale bar 50 μm) (D), or counted was the percentage of AVOs-positive cells (E). Representative images of AVOs positive cells (red arrows), from one of three independent experiments are shown. Significant alterations are expressed relative to controls and marked with asterisks. Mean values from three independent experiments ± SD are presented; * p < 0.05 or ** p < 0.001.

