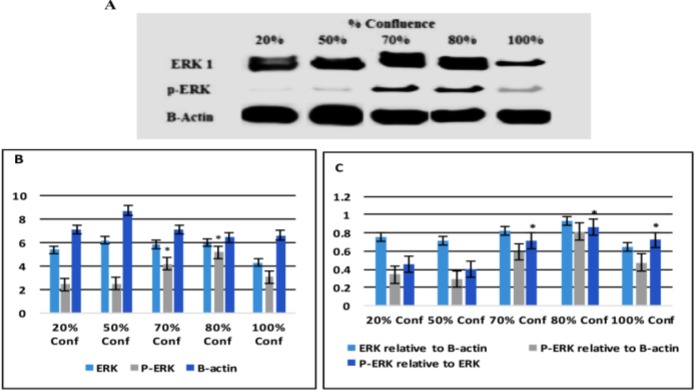
Figure 4:
Erk and P-ERK Protein Signaling Pathway: Total ERK and P-ERK in 20, 50, 70, 80 and 100% confluent BMMSCs were detected by western blot. Immunoreactivity to B- actin was used as a loading control (A).Densitometric measures of band intensity for ERK and P-ERK are shown by using IMAGEJ software (B). Normalized band intensity of ERk and p-ERK relative to actin and P ERK related to ERK are shown by calculation (C). Error bars represent Mean ± SE. Asterisks * indicate significant at P<0.05compared with non-marked groups.

