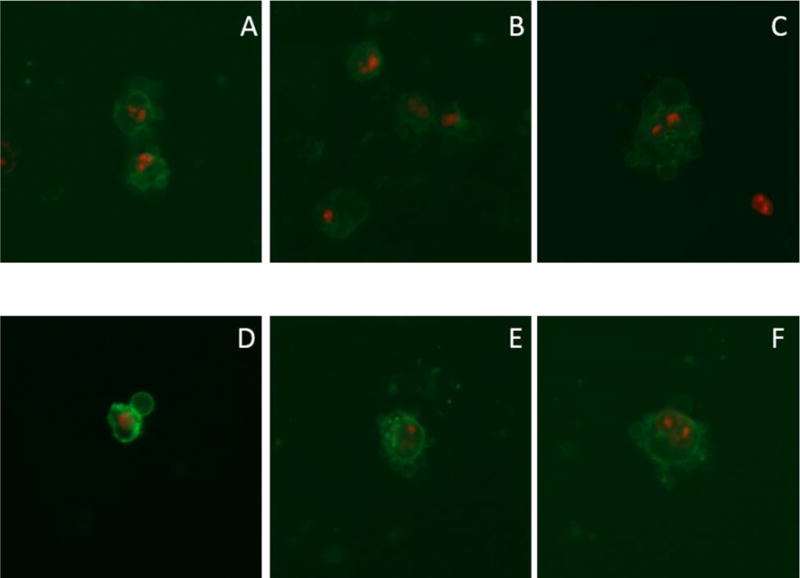
Figure 11.

Images of the Annexin V assay on H460 cells grown in 6-well plates using compound 2 in 10% by weight 2-HPβCD aqueous solution as the compound treatment. All images taken using a 20× objective. Images are presented as a merged image of the green fluorescence and red fluorescence figures, omitting the normal transmitted light image for blebbing clarity. Images AC were taken at the 14-hour time point and D–F were taken at the 17-hour time point.
