Fig. 1.

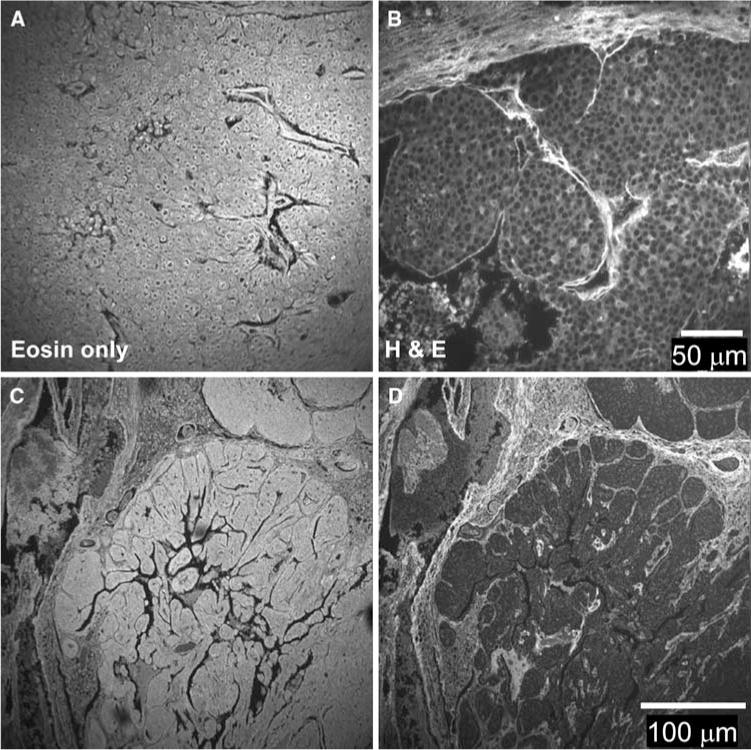
Fluorescence intensity of stained mouse breast tumor samples. a Paraffin-embedded tissue sections were stained with eosin. The fluorescence intensity showed staining in the cytoplasm of cells as well as the surrounding stroma. b Paraffin-embedded tissue sections were stained with H&E. The staining pattern of fluorescence intensity staining pattern was changed such that the intensity of eosin staining in cells was diminished but bright staining of the stroma is still visible. c, d Serial sections stained with eosin-only and H&E, respectively, are shown at lower magnification than A&B. Note the alteration in the staining pattern due to hematoxylin application
