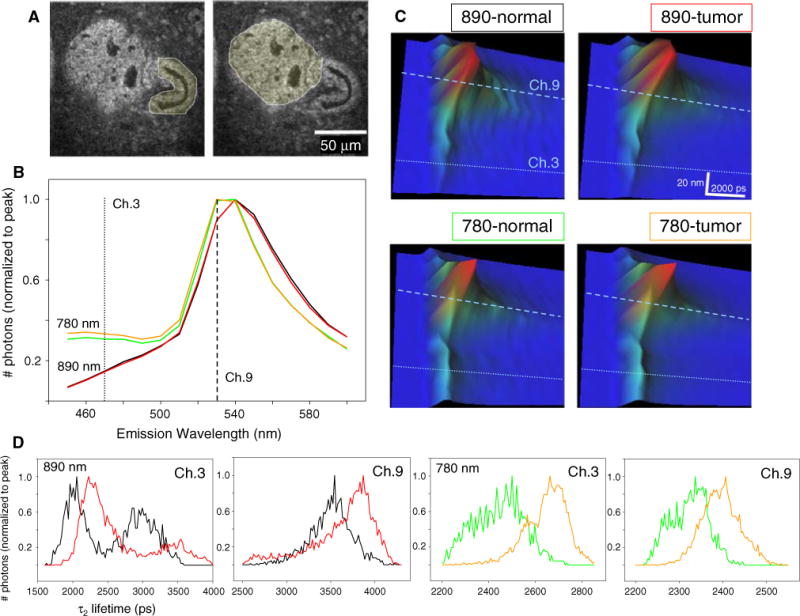
Fig. 5.

Correlation between fluorescence lifetime and emission wavelength. a Intensity images of a carcinoma in situ region where the regions of interest traced to separate normal from tumor analysis is shown. b Emission spectra normalized to peak photon-counts from 890 nm excitation (black line for normal, red line for tumor) and 780 nm excitation (green line for normal, orange line for tumor) show that the presence of higher photon-counts in channel 3 is due to excitation of NADH at shorter wavelengths and not due to differences between normal epithelium (black, green lines) versus tumor (red, orange lines). (c) 3D plot where the lifetime, emission spectra, and photon-counts are plotted in x–y–z, respectively. The longer lifetime in channel 9 is observed at each excitation wavelength and tissue type analyzed. The greater representation of emission in channel 3 when excited at 780 nm can be seen as brighter cyan coloring indicating higher amplitude in the z-axis. d Histograms of τ2 values normalized to peak photon-counts of normal (black line at 890 nm, green line at 780 nm excitation) versus tumor (red line at 890 nm, orange line at 780 nm excitation) regions. Note that there is always a shift to a longer lifetime in tumor tissue. Furthermore the lifetime value is correlated with the emission wavelength, where the shorter emission photons (channel 3) have shorter lifetimes than those found at the peak emission (channel 9) (color online)
