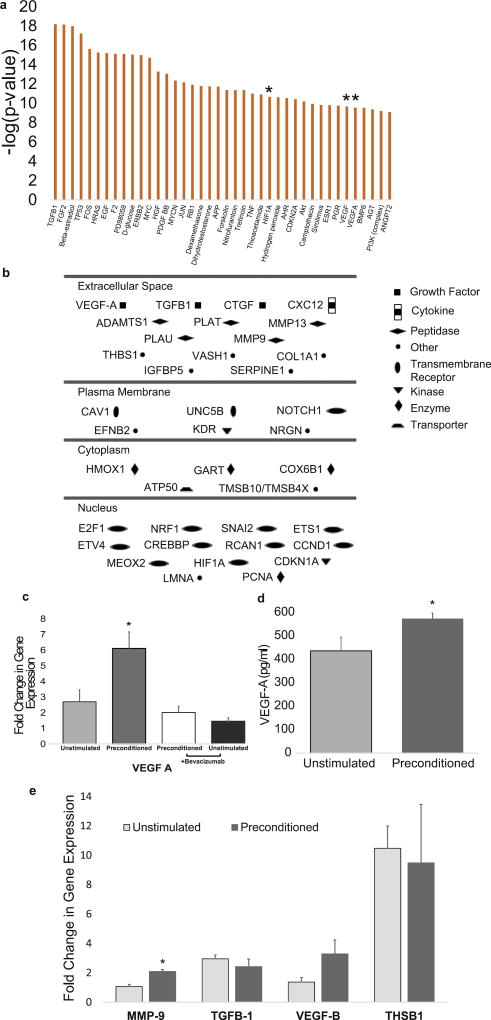
Fig. 2. Gene expression changes with electrical preconditioning.
(A) Genes with the most significant downstream pathway changes in hNPCs (* indicates gene in VEGF pathway) (B) Schematic of significantly altered genes in the VEGF-A pathway and their location (P < 0.05 between stimulated and unstimulated groups after multiple comparison correction). (C) Fold change in gene expression of VEGF-A in hNPCs (* indicates difference P < 0.05 between electrically preconditioned and all other groups, error bars show SE, n = 4, two-tailed Mann-Whitney U test). (D) Concentration of VEGF-A secreted by hNPCs into supernatant (* indicates P < 0.05 from unstimulated, error bars show SE, n = 4, two-tailed Mann-Whitney U test). (E) Fold change in gene expression in hNPCs (** indicates P < .01 from unstimulated, error bars show SE, n = 4, two-tailed Mann-Whitney U test).

