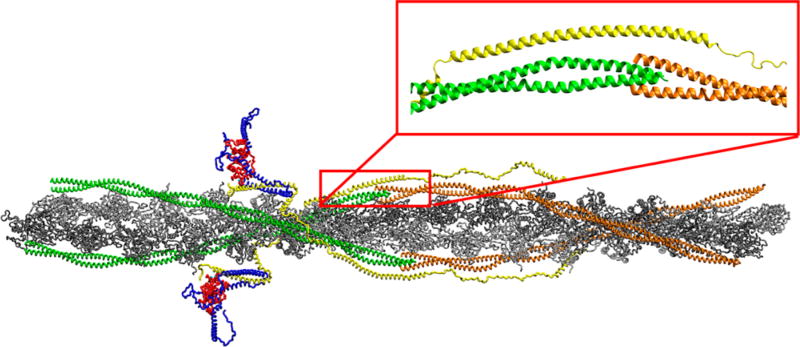
Figure 1.
Atomistic model of the cardiac thin filament. cTnI is colored blue, cTnC red, cTnT yellow, the C-terminal Tm green, and the N-terminal Tm orange. The subset contains the baseline structure of the Tm overlap region. The model structure for the Tm at the overlap assumes a form with orthogonal termini.

