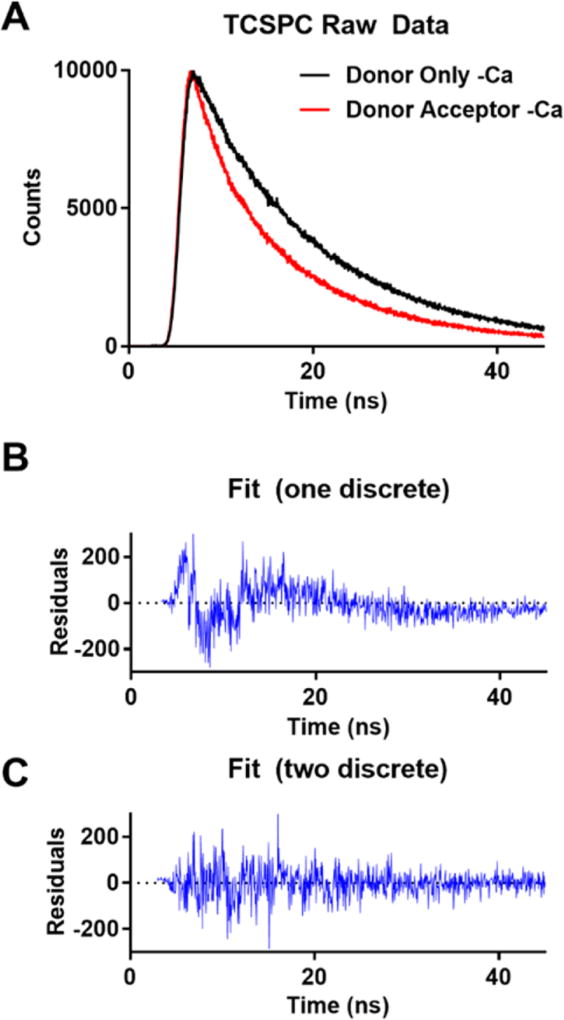
Figure 2.
Time-resolved fluorescence from the cTnT 100C IAEDANS–Tm 271C DDPM FRET pair. (A) Fluorescence decay of the donor only sample (black) compared to the sample with the donor and acceptor (red). The increased rate of decay is indicative of FRET. (B) Residuals for the data shown in panel A when fit with a single discrete population undergoing FRET. (C) Residuals for the data shown in panel A when fit with two discrete populations undergoing FRET. This residual fit does not contain the periodic variance from the data that is observed in panel B.

