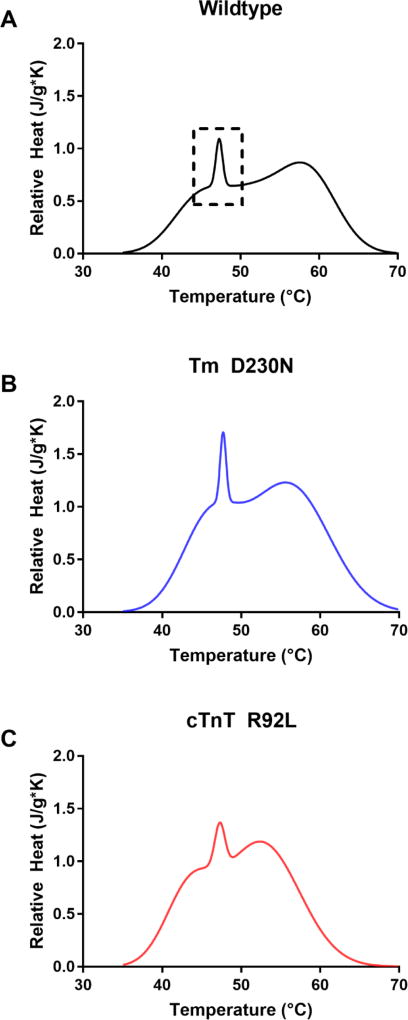
Figure 8.
DSC results for fully reconstituted thin filaments of (A) wild-type, (B) Tm D230N, and (C) cTnT R92L variants. The fwhm of the actin–Tm binding interaction is represented by the sharp peak near 47 °C and represents the cooperativity of the interaction. This interaction is outlined in the wild-type data with a dashed line. The wild-type complex peak (0.993 ± 0.01 °C) is wider than that of the peak from the Tm D230N complex (0.883 ± 0.01 °C) but narrower than that of the cTnT R92L complex (1.38 ± 0.14 °C). The standard deviation resulted from two or three independent experiments.

