
Figure 6.
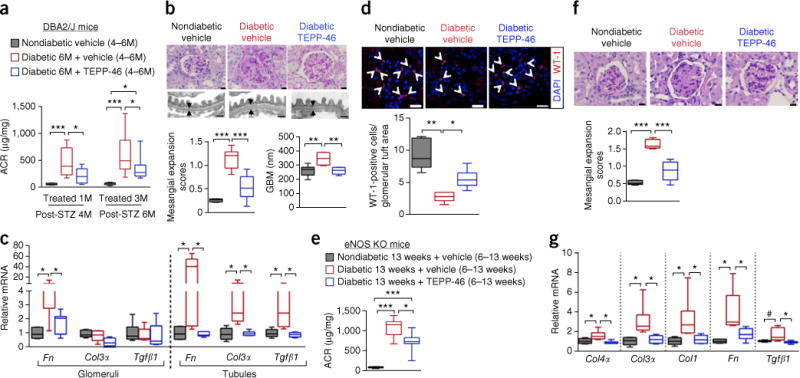
Pharmacologically activating PKM2 by TEPP-46 prevents the development of glomerular pathology. (a) ACR after 1 month of TEPP-46 treatment. Nondiabetic vehicle (n = 6 mice); diabetic vehicle (n = 9 mice); diabetic TEPP-46 (n = 10 mice). ACR after 3 months of TEPP-46 treatment. Nondiabetic vehicle treatment (n = 11 mice); diabetic vehicle (n = 17 mice); diabetic TEPP-46 (n = 15 mice). (b) Representative mesangial expansion at 6 months post-STZ by PAS staining. n = 350 images of kidney sections per group. Nondiabetic vehicle (n = 6 mice); diabetic vehicle (n = 6 mice); diabetic TEPP-46 (n = 7 mice). Scale bars, 10 μm. Representative images of thickness of glomerular basement membrane (GBM). Average of 100 measurements for each mouse and n = 6 mice per group. Scale bar, 0.5 μm. (c) mRNA for glomerular extracellular matrix genes. Nondiabetic vehicle (n = 6 mice); diabetic vehicle (n = 6 mice); diabetic TEPP-46 (n = 7 mice). mRNA for tubular extracellular matrix genes, n = 6 mice per group. (d) Representative confocal immunofluorescence images of Wilms tumor-1 (WT-1) staining. WT-1-positive cell number was normalized to glomerular tuft area. Nondiabetic vehicle, 60 glomeruli from 5 mice evaluated; diabetic vehicle, 91 glomeruli from 5 mice evaluated; diabetic TEPP-46, 88 glomeruli from 6 mice evaluated. Scale bars, 20 μm. (e) ACR at 13 weeks post-STZ eNos-KO mice. Nondiabetic vehicle, n = 5 mice; diabetic vehicle, n = 8 mice; diabetic TEPP-46, n = 7 mice. (f) Representative mesangial expansion (average of 42 glomeruli were assessed) at 13 weeks post-STZ eNos KO mice. Nondiabetic vehicle, n = 5 mice; diabetic vehicle, n = 6 mice; diabetic TEPP-46, n = 6 mice. Scale bars, 10 μm. (g) Extracellular matrix mRNA from kidney cortex. Nondiabetic vehicle (n = 5 mice); diabetic vehicle (n = 6); diabetic TEPP-46 (n = 6 mice). For box plots, center lines represent the median; limits represent quartiles; whiskers represent minimum and maximum values. All data throughout this figure are analyzed using ANOVA. When overall F tests were significant (P < 0.05), post hoc comparisons using Tukey’s method of adjustment were conducted to determine the location of any significant pairwise differences. ***P < 0.001; **P < 0.005; *P < 0.05.