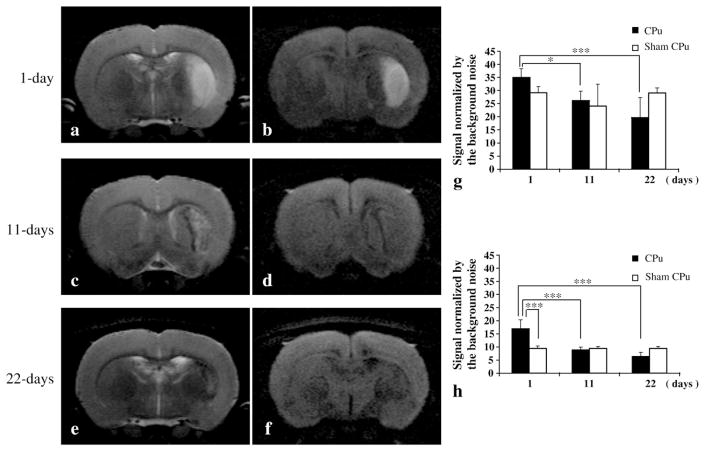
Fig. 3.
Longitudinal observation of T2 and diffusion-weighted MRI after MCAO. (a) T2- and (b) diffusion-weighted MRI from the same day 1 after MCAO animal shown in Fig. 2a, a′. Significant signal enhancement was typically observed at the center and lateral side of the caudate putamen. A part of the ventral side of the cortex was also enhanced in some cases. The enhanced regions on both the T2- and diffusion-weighted MRI corresponded to the signal-reduced area in the MEMRI. (c) T2- and (d) diffusion-weighted MRI for the same day 11 after MCAO animal shown in Fig. 2b, b′. Maculate and feeble signal enhancement was observed on the lateral side of the CPu in the T2-weighted MRI (c). No signal enhancement was observed on the diffusion-weighted MRI (d). Signal reduction corresponding to the MEMRI ring-shaped signal enhancement was observed on both the T2- and diffusion-weighted MRI for the day 11 group (c and d). (e) T2- and (f) diffusion-weighted MRI for the same day 22 after MCAO animal shown in Fig. 2c, c′. (g) Comparison of the normalized T2-weighted MRI in the CPu for the MCAO and sham groups. Significant signal enhancement was observed for the day 1 after MCAO group (***p<0.001, **p<0.05), but this had returned to the original level for the day 11 after MCAO group. (h) Comparison of the normalized diffusion-weighted MRI in the CPu for the MCAO and sham groups. Significant signal enhancement observed for the day 1 after MCAO group (***p<0.001) had returned to the same level as the sham group for the day 11 and day 22 after MCAO groups.

