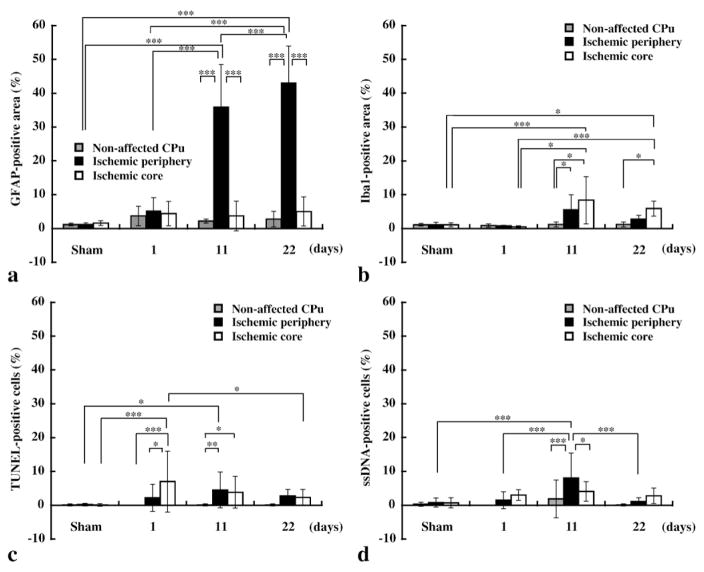
Fig. 5.
Evaluation of immunohistochemical stainings. Gray, black, and white bars indicate areas in non-affected CPu, ischemic periphery, and core, respectively (see also Fig. 7 for the ROI definitions). (a) Comparison of the ratio of the GFAP-positive cell area-to-total area. (b) Comparison of the ratio of the Iba1-positive cell area-to-total area. (c) Comparison of the ratio of the number of TUNEL-positive cells to the total number of cells. (d) Comparison of the ratio of the number of ssDNA-positive cells to the total number of cells. Level of significance: *P<0.05, **P<0.001, and ***P<0.0001 for Tukey’s multiple comparison test.

