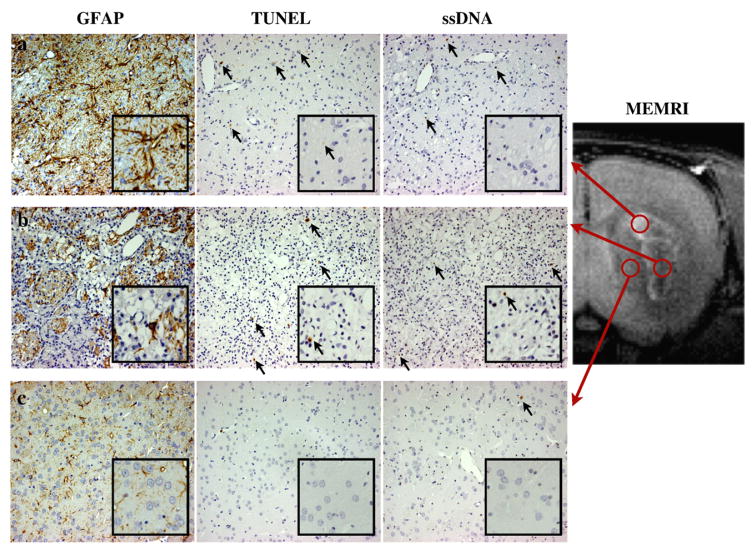
Fig. 7.
Evaluation of apoptosis using TUNEL and ssDNA immunohistochemical stainings. From left to right, the three columns show the results of GFAP, TUNEL, and ssDNA stainings at a magnification of 200× for the day 11 after MCAO group. The inset in the lower right corner of each image is a digital magnification. (a) The images in the upper row were observed in the ischemic periphery corresponding to the signal-enhanced area in the MEMRI (upper red circle). Most of the tissue was replaced by GFAP-positive astroglia. Although TUNEL-and ssDNA-positive cells were also observed in this region (a, black arrows), the density of the positive cells was low (see also Figs. 5c and d). (b) The middle row displays the histology for the ischemic core. Tissue deficit and pyknomorphous cells were observed for all stainings. GFAP-positive astroglia were also observed, although the density was much lower than for the ischemic periphery. (c) The bottom row presents histology corresponding to the nonenhanced part of the CPu in the MEMRI. Few GFAP-positive cells were observed in this region. Also, TUNEL- and ssDNA-positive and pyknomorphous cells were sparse.

