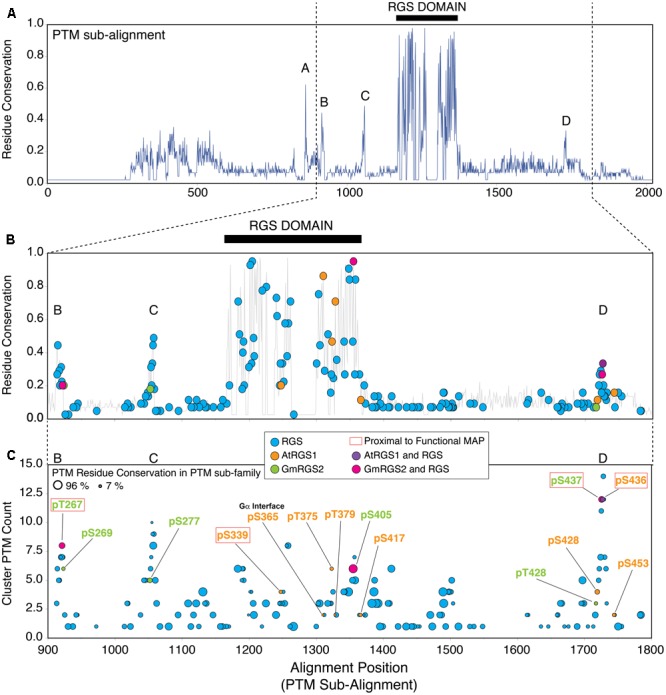
FIGURE 3.

Plant phosphosites are enriched in well-conserved phosphorylation clusters observed in non-plant RGS proteins. (A) Residue conservation (% identity) derived from MSA of AtRGS1, GmRGS2 and all non-plant RGS proteins that harbor at least one post-translational modification (PTM) (PTM sub-family). Five well-conserved regions are observed from the alignment, including: short conserved sequence regions SCR-A, SCR-B, SCR-C, SCR-D, and the RGS domain (black bar). Positions 1–2000 are shown. (B) Modified alignment positions (MAPs) for all curated PTMs in the PTM sub-family of RGS proteins. Plant MAPs are included and each MAP type is color-coded as indicated in the inset. Positions 900–1800 are shown. (C) Plant and non-plant MAPs organized by cluster PTM count (corresponds to the PTM count observed within all MAPS ±2 alignment positions flanking the target MAP). Size of each circle indicates the percent conservation of PTM-acceptor residues within the MAP. Red boxed labels indicate that the plant MAP is proximal (±2 alignment positions) to a non-plant PTM site with a characterized biological function (see text). “RGS” MAPs correspond to MAPs harboring non-plant PTMs exclusively. 7TM-RGS proteins from plants. Black bars indicate the position of the RGS domains.
