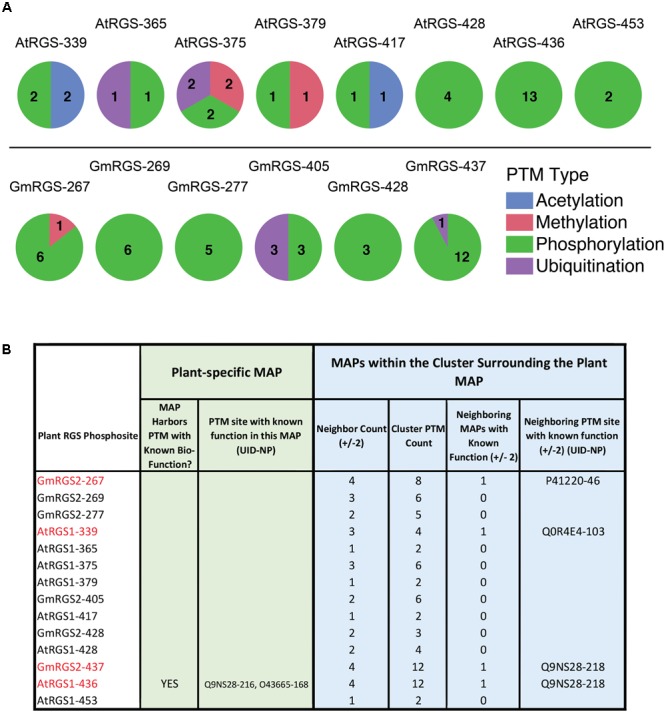
FIGURE 4.

Post-translational modification cluster characteristics of plant phosphosites. (A) PTM types observed in PTM clusters surrounding each of the 14 plant MAPs. (top) AtRGS1-specific cluster analysis. (bottom) GmRGS2-specific cluster analysis. Numbers correspond to the number of unique PTMs found in each cluster (by PTM type). (B) Table showing the specific cluster characteristics for each plant phosphosite, including those within close proximity to biologically functional PTMs in non-plant RGS proteins. Neighbor count corresponds to the number of MAPs within ±2 alignment positions of the plant MAP (maximum = 4). Cluster PTM count corresponds to the total number of PTMs observed within ±2 alignment positions of the plant MAP. Neighboring MAPs with known function corresponds to a binary classifier for proximal functional PTMs (0 = NO, 1 = YES). UID, UniProt ID; NP, native position of the modified residue.
