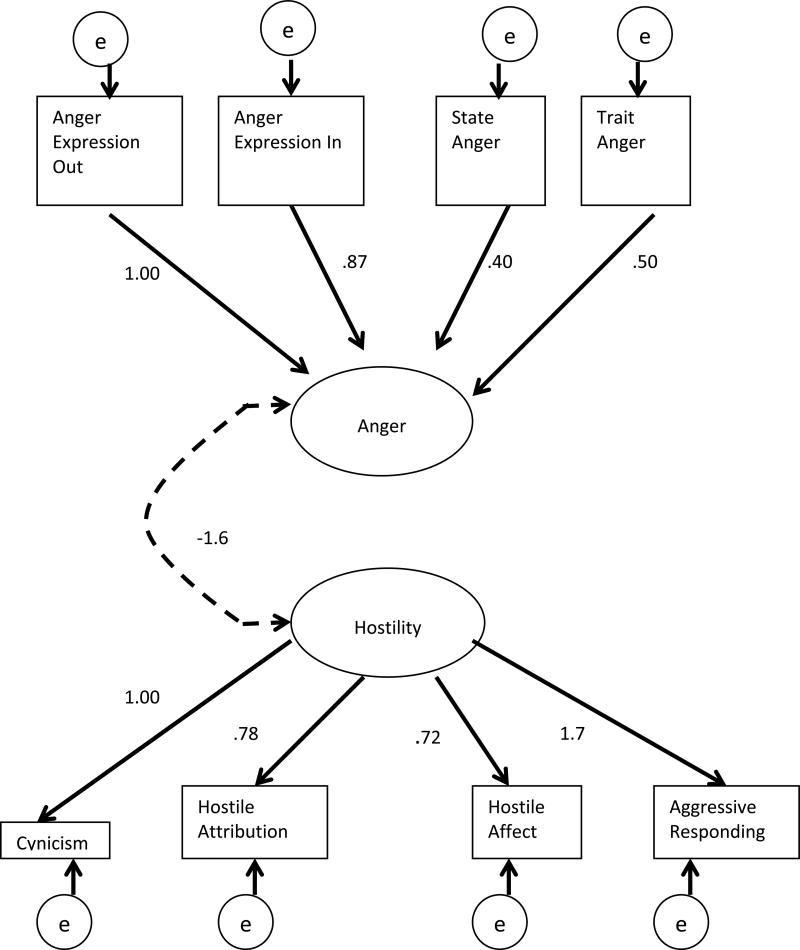
Figure 1. Confirmatory Factor Analysis of Anger and Hostility.
Anger and Hostility are the latent variables and boxes represent all of the observed variables. The path loadings presented above are non-standardized estimates (B) and the solid lines represent significant paths at p<.05. Fit indices for this model are: CFI = 0.99, TLI = 0.98, and RMSEA = 0.03. The dashed line represents a non-significant path (p = .09).

