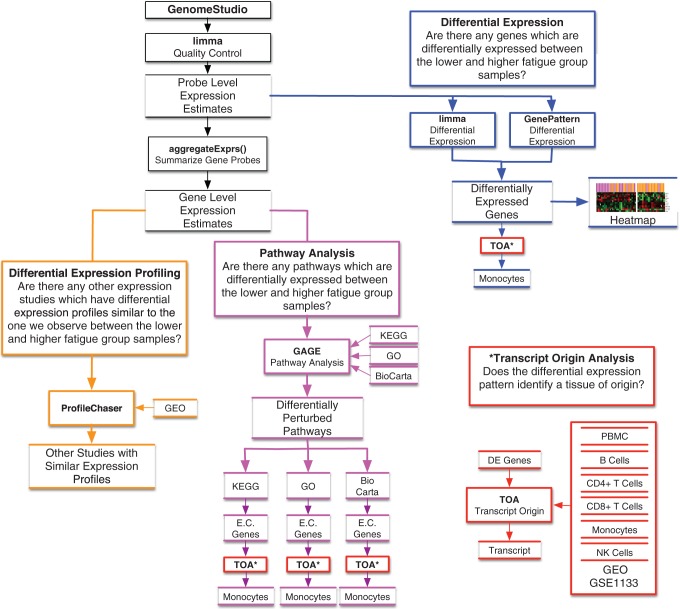
Figure 1.
Experimental approach and analysis plan. The diagram illustrates the analysis plan for the study, which includes differential expression (blue outline), differential expression profiling (orange outline), pathway analysis (purple outline), transcript origin analysis (red outline), and ProfileChaser (orange outline). Closed boxes denote analysis or software, and open boxes denote data or results. aggregateExprs() = a function contained in the PGSEA R (version 1.44.0) statistical software package; DE = differentially expressed; E.C. genes = essential contributing genes; GAGE = Generally Applicable Gene Set Enrichment; GEO = gene expression omnibus; GO = gene ontogeny; GSE = GEO series; KEGG = Kyoto Encyclopedia of Genes; NK = natural killer; PBMC = peripheral blood mononuclear cell (dendritic); TOA = transcript origin analysis.

