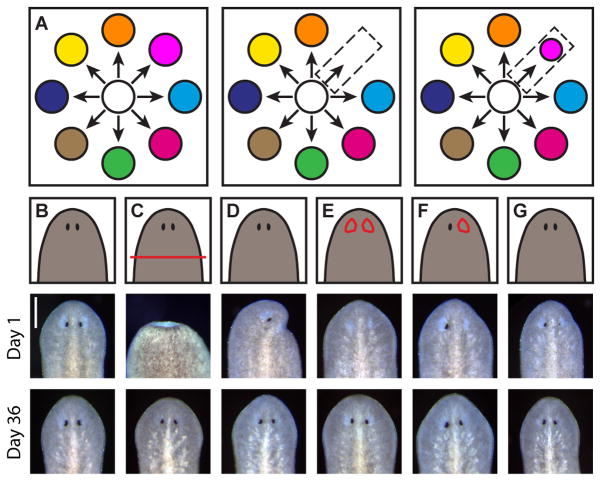
Figure 1. Planarian eyes exhibit tissue-specific regeneration.
(A) Tissue-specific regeneration schematic. White circle represents the neoblast population, colored circles represent distinct differentiated tissues. Neoblasts produce differentiated tissue types (left). Tissue-specific injury (center) is followed by tissue-specific regeneration (right).
(B–G) Cartoons (top) and live images 1 day (center) and 36 days (bottom) after no injury (B), decapitation (C), half decapitation (D), bilateral eye resection (E), right eye resection (F), and partial right eye resection (G). Scale bar, 200 μm. See also Figures S1A–S1C.

